PPC
April 24, 2026
8 Important PPC metrics to track for campaign success in 2026


Wasted ad spend usually comes down to one problem: marketers track the wrong metrics or track the right ones too late. In PPC advertising, the numbers you monitor determine whether a campaign scales profitably or slowly drains your budget.
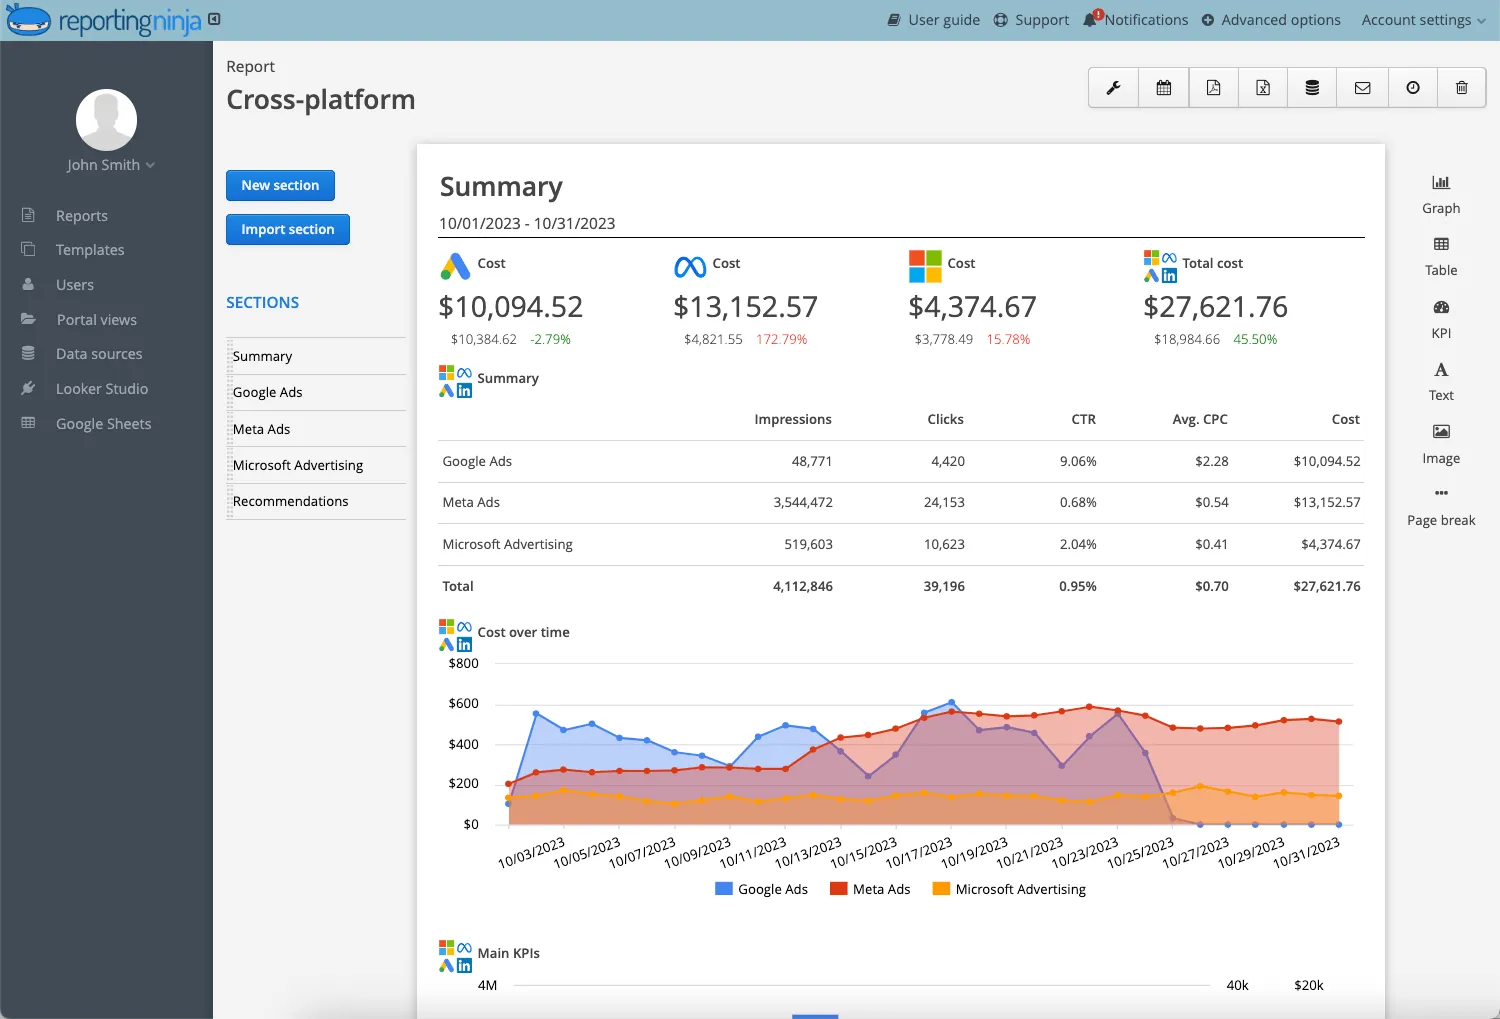
This guide breaks down the most important PPC metrics for 2026 and explains exactly why each one matters. You’ll also see how to evaluate performance across Google Ads, Microsoft Advertising, Meta, and LinkedIn, and how to turn raw numbers into practical optimization steps.
PPC metrics are the data points that show how your paid campaigns are performing across search, social, and display channels. They measure actions like impressions, clicks, and conversions so you can evaluate whether your ads are driving meaningful results.
Metrics tell you what is happening. KPIs tell you whether it matters. While metrics track activity, KPIs connect that activity to business goals such as revenue, lead quality, or customer acquisition.
Understanding the distinction helps you build reporting frameworks that prioritize outcomes rather than vanity metrics.
Measuring PPC metrics gives you the visibility you need to optimize campaigns with confidence. It helps you understand what’s working, what isn’t, and where your budget delivers the strongest return. Tracking these metrics is essential because it allows you to:
Effective PPC reporting turns scattered metrics into insights you can act on. This is especially important when managing multichannel campaigns that require consistent, accurate performance data.
Mastering these essential metrics enables you to optimize every aspect of your paid campaigns. Each metric provides unique insights into campaign performance, from initial ad visibility through final conversion.
For comprehensive performance tracking, explore SEM reporting strategies and cross-channel attribution models.
CTR measures the percentage of people who click your ad after seeing it, calculated by dividing clicks by impressions. A 5% CTR means 5 out of every 100 people who see your ad click on it. This metric reveals how compelling your ad copy, visuals, and offers are to your target audience.
High CTR signals strong ad relevance to Google's algorithm, directly improving your Quality Score and lowering CPC costs.
Conversion rate measures the percentage of clicks that lead to a defined action—such as a purchase, signup, or demo request. It shows how effectively your landing pages and offers turn interest into outcomes.
A high conversion rate means the post-click experience matches user expectations and supports your campaign goals.
CPC measures how much you pay for each click, while CPA measures the total cost required to generate one conversion.
CPC helps you understand how competitive your bids are, and CPA shows whether your campaigns are profitable once clicks turn into actual outcomes. Together, they reveal how efficiently your budget moves users from impression to conversion.
ROAS measures how much revenue you generate for every dollar spent on ads. A ROAS of 4:1 means you earn four dollars for each dollar invested. It’s one of the clearest indicators of whether your campaigns are profitable.
ROAS helps you compare performance across channels, products, and audiences so you can allocate budget to the areas that deliver the strongest returns.
You can apply this same framework to your next paid campaign reporting to ensure ROI insights are consistent across campaigns.
Quality Score is Google’s 1–10 rating of your ad relevance, expected CTR, and landing page experience. It influences your ad rank and how much you pay per click, making it a key factor in the efficiency of any Google Ads campaign.
A higher Quality Score helps you win more auctions at lower CPCs, improving visibility without increasing spend.
Impression share measures the percentage of total eligible impressions your ads actually receive. For example, a 60% impression share means your ads appeared in 60% of the auctions where they could have shown.
A lower impression share highlights missed visibility, either because of limited budgets or low ad rank. Tracking it helps you understand how much potential traffic you’re capturing compared to competitors.
Ad position reflects where your ads typically appear on the search results page. While Google no longer shows exact position numbers, monitoring average placement helps you understand your visibility relative to other advertisers.
Higher positions usually generate more clicks, but they can also increase costs. The goal is to find the position that delivers the best balance between visibility, CPC, and conversion performance.
Even when you know which PPC metrics to track, getting accurate, consistent data can be difficult. Most marketers face a mix of technical, operational, and reporting challenges that slow down decision-making.
Running campaigns across Google Ads, Microsoft Advertising, Meta, LinkedIn, and other channels creates isolated data sets. When performance lives in separate dashboards, it’s hard to compare results, understand trends, or build a full picture of ROI.
This often forces teams to export data into spreadsheets, increasing the risk of errors and making cross-channel analysis slow and inconsistent.
Most users interact with multiple ads and channels before converting. Without a clear attribution model, it becomes difficult to understand which campaigns contribute the most value. This leads to budget decisions based on incomplete or misleading data.
Many marketers still build weekly or monthly reports by copying data between platforms, updating charts, and rebuilding dashboards. These repetitive tasks can take hours each week and leave less time for strategic optimization.
Incorrect pixel setups, missing events, privacy restrictions, or broken tracking scripts create gaps in performance data. Without accurate conversions, metrics like CPA and ROAS become unreliable, making optimization guesswork.
Regular audits and backup tracking methods are essential for maintaining clean, trustworthy data.
{{cta-block-v1}}
With dozens of available metrics in every platform, new advertisers often focus on numbers that don’t tie back to business outcomes. High impressions or click volume may look positive but reveal little about profitability or conversion quality.
Clear metric frameworks help teams avoid vanity metrics and focus on the indicators that drive meaningful results.
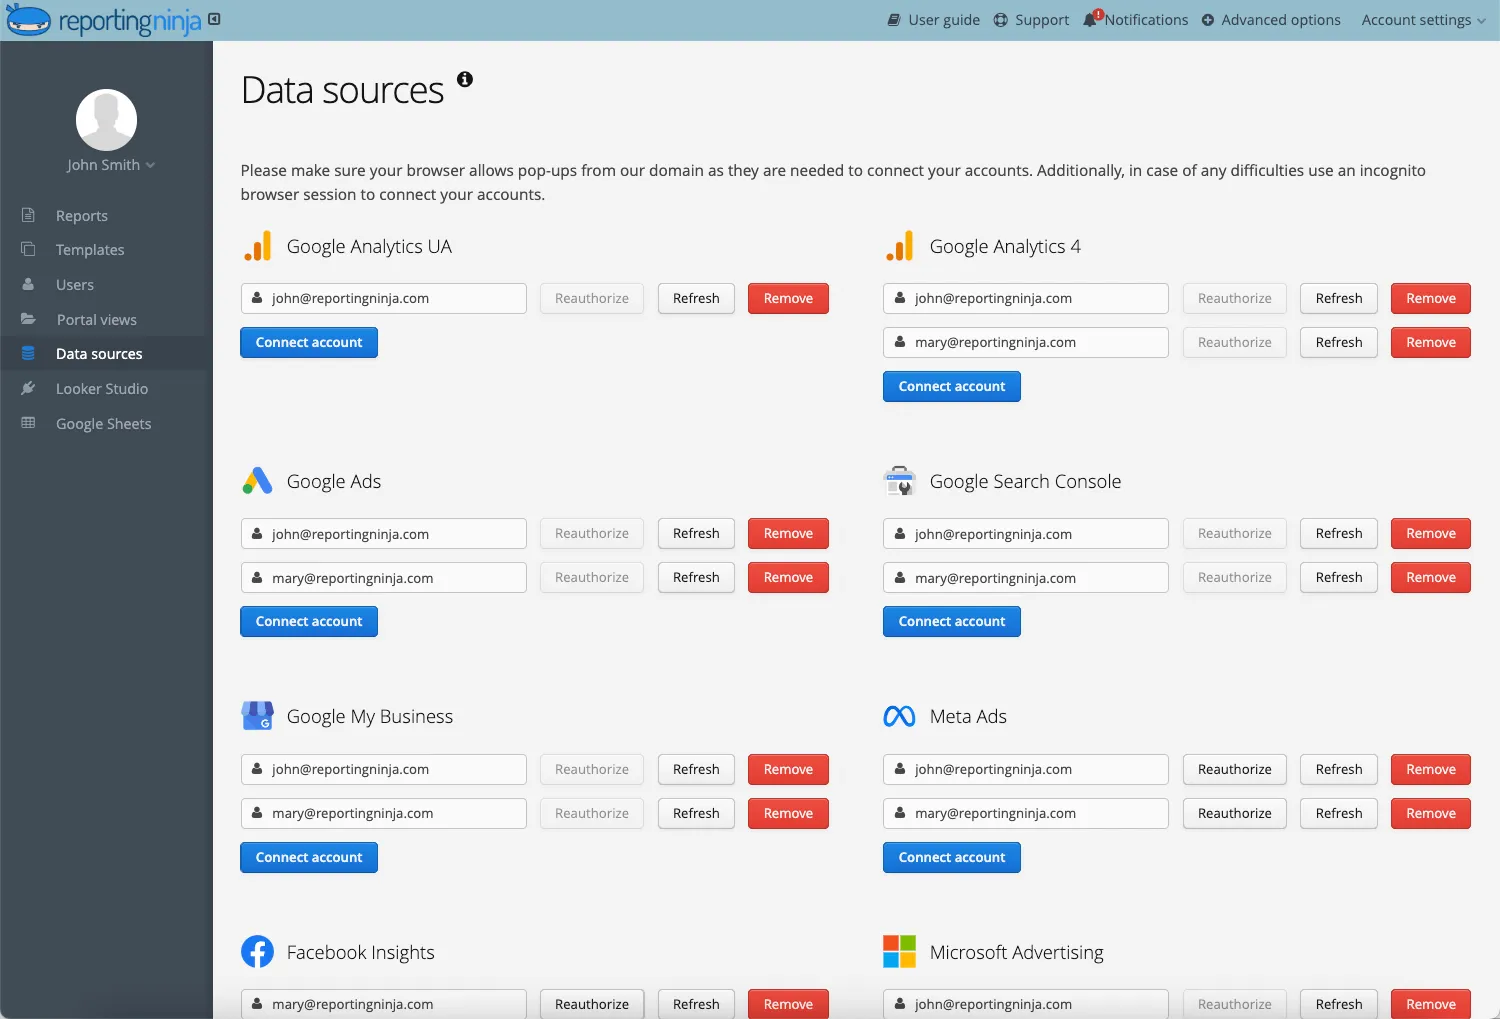
Reporting Ninja brings all your PPC metrics into one place, eliminating manual data collection and giving you a consistent view of performance across every advertising channel. Instead of switching between dashboards or updating spreadsheets, you can track CTR, CPA, ROAS, and other core metrics from a single automated reporting platform.
Integrate Google Ads, Microsoft Advertising, Meta, LinkedIn, and other channels directly. Once connected, Reporting Ninja automatically pulls campaign, ad group, and keyword-level data—no exports or uploads required.
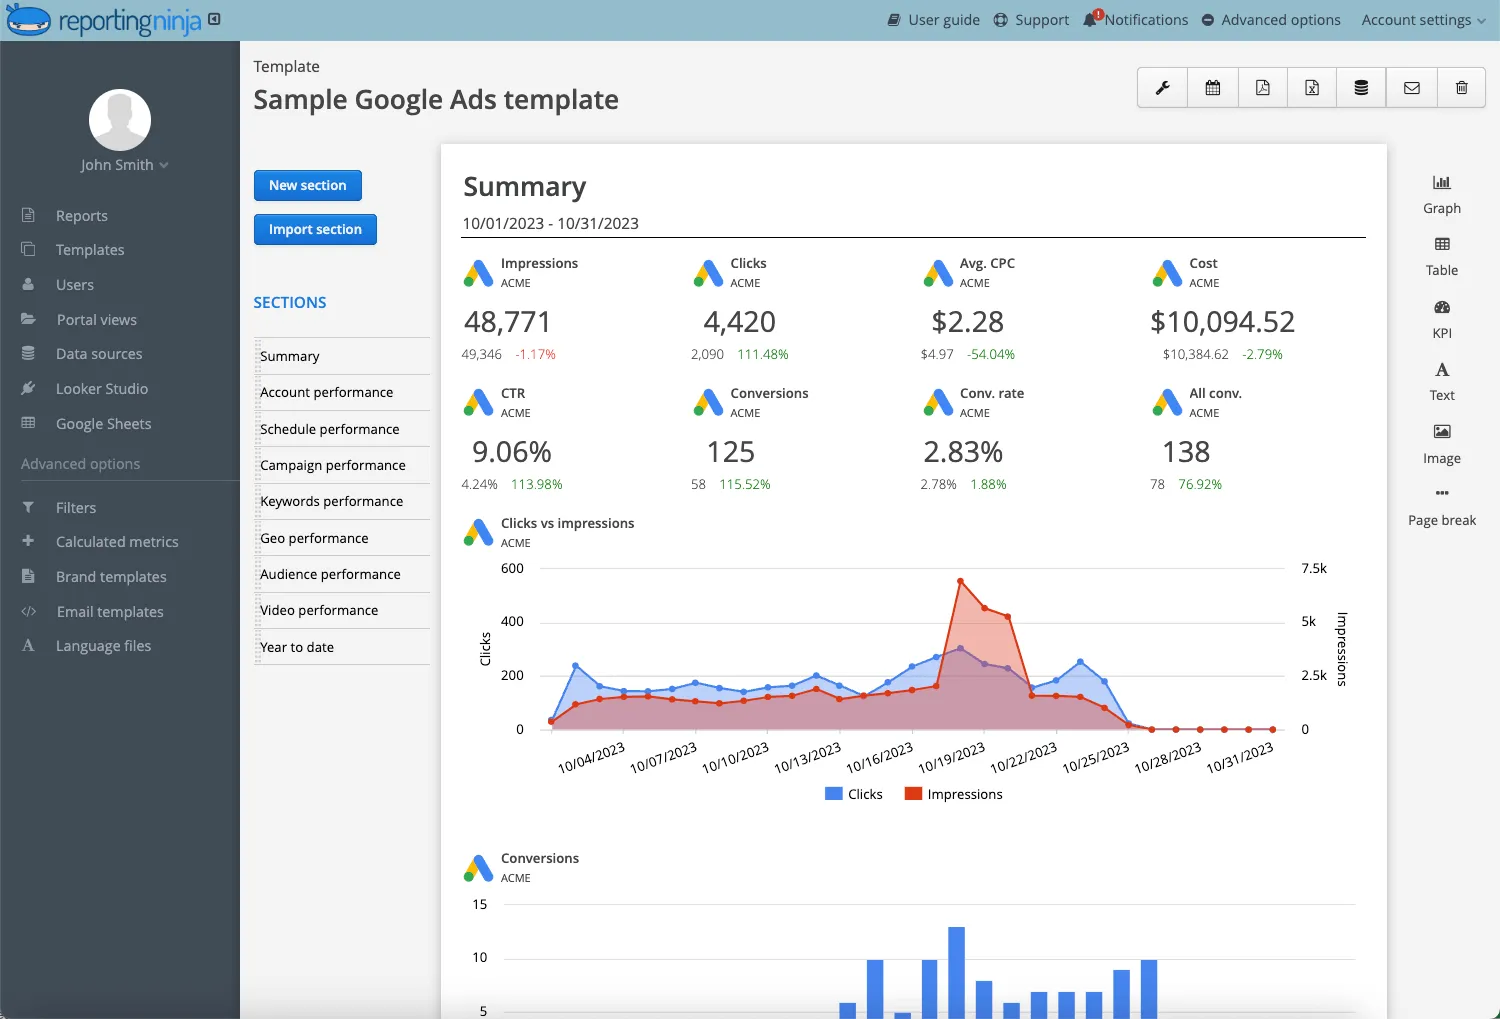
Create custom reports that highlight the KPIs you want to monitor, from CTR and conversion rate to ROAS and Quality Score. Organize them by channel, campaign, or audience to get a clear view of performance at every level.
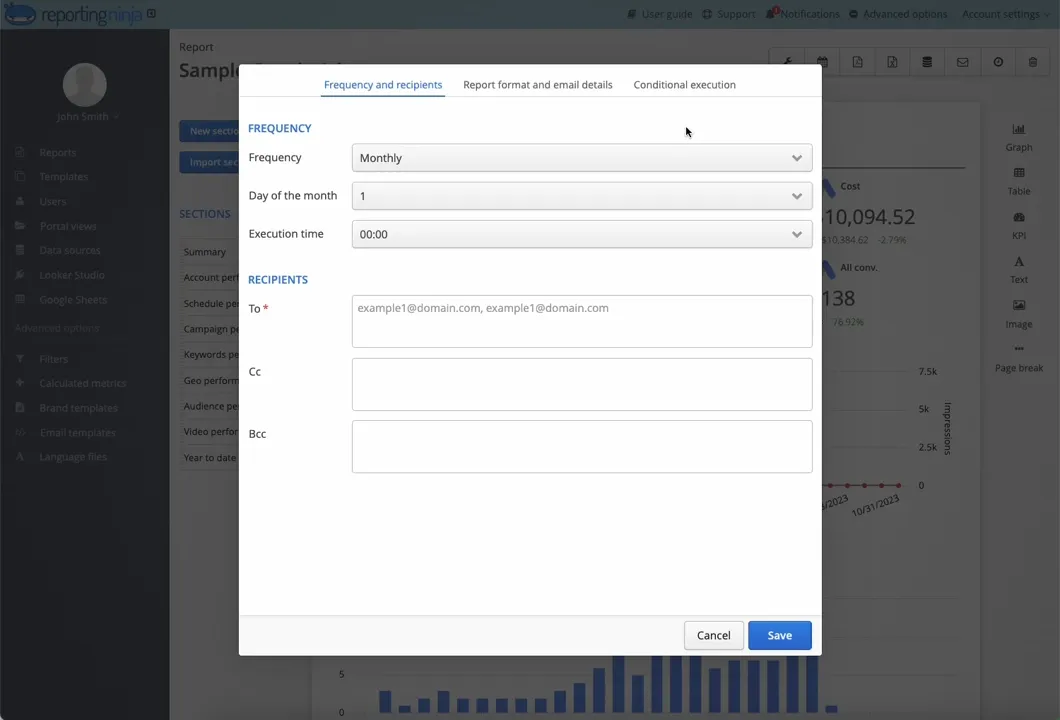
Schedule reports to send daily, weekly, or monthly to your team or stakeholders. With Reporting Ninja, you can automate PPC report delivery, removing repetitive tasks and keeping everyone aligned with the latest performance data.
Use cross-channel reporting to analyze how each platform contributes to your overall results. Identify which channels deliver the strongest ROAS, where budgets should shift, and how campaigns perform side by side.
Reporting becomes faster, more accurate, and easier to scale, giving you more time to focus on optimization rather than data collection.
Ready to simplify your PPC reporting? Start your free trial and experience automated, accurate reporting that saves hours every week.
CTR varies by industry and campaign type, but these benchmarks provide a useful starting point:
Use industry benchmarks for reference, but compare them to your own historical performance to determine realistic improvement goals.
Several tools help monitor performance across platforms:
Reporting Ninja stands out for consolidating metrics from multiple ad platforms into customizable reports without manual data handling.
Comparing the top-rated SEM reporting tools can help you find the best fit for your specific agency or brand needs.
LTV represents the total revenue a customer generates over their relationship with your business. It helps you understand how much you can profitably spend to acquire a customer.
Formula:
Average purchase value × Purchase frequency × Customer lifespan
For example:
If customers spend $100 per order, buy four times per year, and stay for three years, LTV is $1,200. This gives you more flexibility in determining acceptable CPA targets.
ROAS measures revenue generated for every dollar spent on ads.
POAS measures profit generated for every dollar spent on ads, factoring in product and fulfillment costs.
POAS gives a clearer picture of true profitability, especially when margins vary across products. A campaign may show strong ROAS but weak POAS if costs are high.
Sign up for a 15 days free trial. No credit card required.

Build and automate amazing custom reports in a few clicks. Save time, be more productive, impress your clients.